скрипт Bindtop - статистика bind
Описание
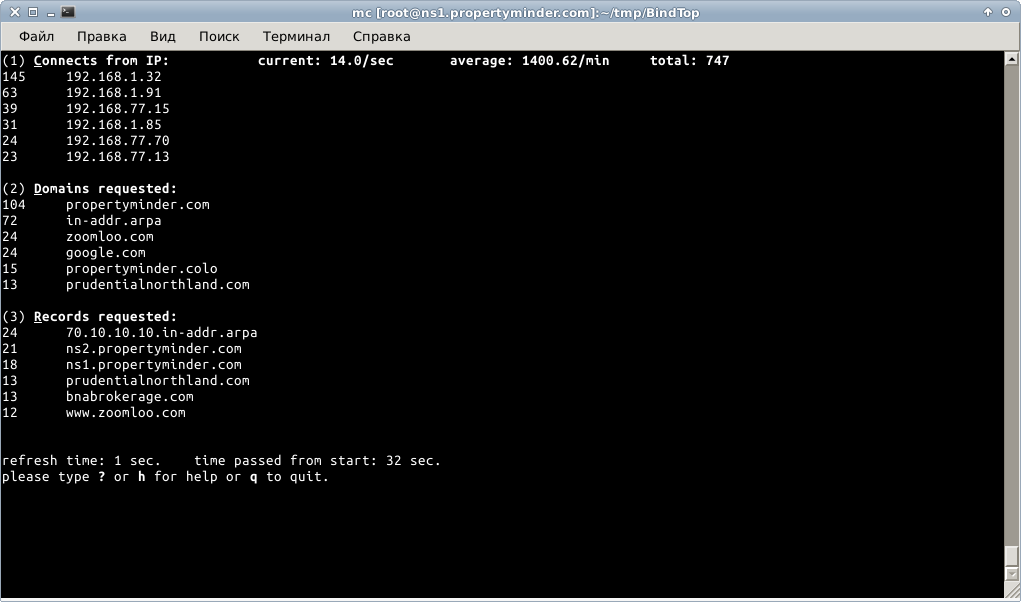
Скрипт читает лог-файл bind-9, на лету обрабатывает и показывает статистику:
- мгновенная скорость поступления запросов в секунду (сколько запросов пришло за последнюю секунду)
- средняя скорость поступления запросов (запросов в минуту или запросов в секунду)
- количество поступивших запросов за время наблюдения
- TOP 6 IP адресов с которых поступили запросы
- TOP 6 доменов второго уровня, которые были запрошены
- TOP 6 запросов
Требования и недостатки
Для работы скрипта нужно настроить bind для логирования запросов. Для этого в named.conf в секции logging необходимо указать например следующее:
logging {
    channel query_log {
        file "/var/log/bind/bind.log";
        severity dynamic;
        print-time yes;
    };
    category queries { query_log; };
};
Скрипт написан на perl, кроме того, используется сторонняя библиотека PortableReadKey.pm (я не помню где ее брал). Эта библиотека считывает нажатую клавишу из терминала без блокирования работы скрипта. Библиотека находится в архиве со скриптом.
Алгоритм работы скрипта:
1). Открываем файл и перемещаемся в конец файла
2). Спим 1 секунду
3). Просыпаемся, читаем файл до конца (пока не встретим EOF), обрабатываем
4). Показываем статистику
5). Спим 1 секунду
6). Сбрасываем флаг EOF в файловом дескрипторе, переходим к п.3
В данном алгоритме есть два недостатка:
1). Если в файл пишется очень много данных (что может случиться во время реальной DDOS атаки), то скрипт просто не успевает прочитать и обработать данные из файла и зависает на п.3
Решением может быть установка прерывания по времени.
2). Скрипт спит 1 сек, потом вычитывает новые данные, считает абсолютное количество поступивших запросов и считает, что это количество пришло в одну секунду. На самом деле эти данные пришли за время 1 сек+время обработки данных. Т.е. точность данных "запросов в секунду" не совсем правильная, и зависит от нагрузки на сервер.
Использование (Usage)
Скачать архив, распаковать, указать в скрипте в переменной $logfile путь до query-лога, запустить.
1 2 3 4 5 6 7 8 9 10 11 12 13 14 15 16 17 18 19 20 21 22 23 24 25 26 27 28 29 30 31 32 33 34 35 36 37 38 39 40 41 42 43 44 45 46 47 48 49 50 51 52 53 54 55 56 57 58 59 60 61 62 63 64 65 66 67 68 69 70 71 72 73 74 75 76 77 78 79 80 81 82 83 84 85 86 87 88 89 90 91 92 93 94 95 96 97 98 99 100 101 102 103 104 105 106 107 108 109 110 111 112 113 114 115 116 117 118 119 120 121 122 123 124 125 126 127 128 129 130 131 132 133 134 135 136 137 138 139 140 141 142 143 144 145 146 147 148 149 150 151 152 153 154 155 156 157 158 159 160 161 162 163 164 165 166 167 168 169 170 171 172 173 174 175 176 177 178 179 180 181 182 183 184 185 186 187 188 189 190 191 192 193 194 195 196 197 198 199 200 201 202 203 204 205 206 207 208 209 210 211 212 213 214 215 216 217 218 219 220 221 222 223 224 225 226 227 228 229 230 231 232 233 234 235 236 237 238 239 240 241 242 243 244 245 246 247 248 249 250 251 252 253 254 255 | #! /usr/bin/perl # # This script read bind9 log-file and show stats about requests # !!script uses PortableReadKey.pm library!! # # you should configure bind to log queries before use. # set logging channel like in example: # # logging { # channel query_log { # file "/var/log/bind/bind.log"; # severity dynamic; # print-time yes; # }; # category queries { query_log; }; # } # # Also you should set $logfile variable below # # version 0.1, copyright: valynkin pavel, 2015 # my $logfile="/var/named/chroot/var/log/named/query.log"; use strict; #use warnings; #use Term::ANSIColor; use IO::Handle; use Switch; use sigtrap qw/handler signal_handler normal-signals/; sub signal_handler { close LOGFILE; PortableReadKey::turnOnEcho(); print "\nbye!\n"; exit;} # # Preferences # my $output_freq=1; my $number_of_lines_to_print=5; my $naptime = 1; &set_view_to_default; # # declare global counters my $cnt_connects = 0; my $total_connects = 0; my %IN_IP; my $cnt_domains = 0; my $total_domains = 0; my %DOMAINS; my $cnt_records=0; my $total_records = 0; my %RECORDS; # # declare global variables my $line; my $pattern; my $start_time = time(); my $last_print_time = $start_time; my $time_now; my ($show_connects,$show_connects_details); my ($show_domains,$show_domains_details); my ($show_records,$show_records_details); my $show_all_details; my $instant_stats_window = "sec"; my $average_stats_window; # # Init PortableReadKey # use PortableReadKey; PortableReadKey::getKeyInit(); PortableReadKey::clearScreen(); PortableReadKey::turnOffEcho(); my $key; # # Main cyrcle # open (LOGFILE, $logfile) or die "can't open $logfile: $!"; seek (LOGFILE,-1,2) or die "can't seek to the end of $logfile"; # go to the end of file #print "\033[2J"; print "\033[0;0H"; # clear screen PortableReadKey::clearScreen(); print "Collecting data, please wait $output_freq seconds...\n"; for (;;) { while (<LOGFILE>) { &count_stats ($_); } # read to EOF, parsing each line and count all counters $time_now=time(); # if time to output - do it if (($time_now-$last_print_time) >= $output_freq){ $last_print_time=$time_now; &output (); } sleep $naptime; LOGFILE->clearerr( ); # clear EOF flag &signal_handler if (stat(LOGFILE))[3] == 0; # exit if no links to logfile (nobody writes to file = so file has been rotated) # # Keyboard hooks # $key = PortableReadKey::getKeyNonBlocking(); if ($key) {&keys_handler ($key);} } # # Sub for parsing and coutnts # sub count_stats { my $hashref1; $line=$_[0]; chomp $line; # # count requests/sec # $pattern=".*client ([0-9]+\.[0-9]+\.[0-9]+\.[0-9]+)#.*"; ($cnt_connects,$total_connects,$hashref1) = &count ($cnt_connects,$total_connects,\%IN_IP); %IN_IP = %{$hashref1}; # # count requested domains per second # $pattern="^.*client [0-9]+\.[0-9]+\.[0-9]+\.[0-9]+#[0-9]+: query: (?:[^\.]+\.)*?([^\.]+\.[^\.]+) IN .+"; ($cnt_domains,$total_domains,$hashref1) = &count ($cnt_domains,$total_domains,\%DOMAINS); %DOMAINS = %{$hashref1}; # # count requested records # $pattern=".*client [0-9]+\.[0-9]+\.[0-9]+\.[0-9]+#[0-9]+: query: (.+) IN .+"; ($cnt_records,$total_records,$hashref1) = &count ($cnt_records,$total_records,\%RECORDS); %RECORDS = %{$hashref1}; } # # Sub for output counters # sub output { my $instant_value; my $average_value; # print "\033[2J"; print "\033[0;0H"; # clear screen PortableReadKey::clearScreen(); # # print requests per second # ($instant_value,$average_value) = &calculate ($cnt_connects,$total_connects); &print_to_screen ("(1)\e[1m \e[4mC\e[24monnects from IP:\t\tcurrent: $instant_value/$instant_stats_window\taverage: $average_value/$average_stats_window\t total: $total_connects \e[0m\n") if $show_connects == 1; &print_to_screen ("",\%IN_IP) if ($show_connects == 1 && $show_connects_details ==1); $cnt_connects=0; # # print requested domains # ($instant_value,$average_value) = &calculate ($cnt_domains,$total_domains); &print_to_screen ("(2)\e[1m \e[4mD\e[24momains requested: \e[0m \n") if $show_domains == 1; &print_to_screen ("",\%DOMAINS) if ($show_domains == 1 && $show_domains_details ==1); $cnt_domains=0; # # print requested records # ($instant_value,$average_value) = &calculate ($cnt_records,$total_records); &print_to_screen ("(3)\e[1m \e[4mR\e[24mecords requested: \e[0m \n") if $show_records == 1; &print_to_screen ("",\%RECORDS) if ( $show_records == 1 && $show_records_details ==1 ); $cnt_records = 0; # # footer # $instant_value = time() - $start_time; &print_to_screen ("\nrefresh time: $output_freq sec.\ttime passed from start: $instant_value sec.\nplease type \e[1m?\e[0m or \e[1mh\e[0m for help or \e[1mq\e[0m to quit.\n"); } # # sub print_to_screen accepts following: <name_of_value> <value> <\%HASH_NAME> # sub print_to_screen { # my $name_of_value = $_[0]; # my $value = $_[0]; # print color 'bold'; print "$_[0]"; # print color 'reset'; return if ( !$_[1] ); my $count=1; foreach(sort {${$_[1]}{$b} <=> ${$_[1]}{$a}} keys %{$_[1]}) { print ${$_[1]}{$_},"\t",$_,"\n"; last if $count>$number_of_lines_to_print; $count++; } print "\n"; } sub count { my $numb_of_args = scalar (@_); my $conunter = shift; my $totals = shift; my %HASH = %{shift()}; my %HASH1; # %HASH1 = %{shift()} if ($numb_of_args > 3); %HASH1 = %{@_[0]} if ($numb_of_args > 3); if ($line =~ /$pattern/ ){ $conunter++; $totals++; my $a=$1; my $b=$2; if (exists($HASH{$a})){$HASH{$a}++;} else {$HASH{$a}=1;} if ($numb_of_args > 3) {if (exists($HASH1{$b})){$HASH1{$b}++;} else {$HASH1{$b}=1;}} } return $conunter,$totals,\%HASH,\%HASH1 if ($numb_of_args > 3); return $conunter,$totals,\%HASH if ($numb_of_args <= 3); } sub calculate { my $cnt = shift; my $tot = shift; my $instant_value = sprintf "%.1f",($cnt/$output_freq); my $average_value; $average_value = ($average_stats_window eq "sec")?(sprintf "%.2f",($tot/($time_now-$start_time))):(sprintf "%.2f",($tot/(($time_now-$start_time)/60))); return $instant_value, $average_value; } sub helpscreen { PortableReadKey::clearScreen(); print <<"HELP_SCREEN"; \e[1m You can use folowing keys:\e[0m C or c - show/hide Connects stats 1 - show/hide Connects details D or d - show/hide Domains stats 2 - show/hide Domains details R or r - show/hide Requests stats 3 - show/hide Requests details A or a - show all stats 4 or v - show/hide all details 0 or / - set screen to default view M or m - switch average stats from per-minutes to per-seconds and back \e[1m - \e[0m or \e[1m + \e[0m to increase/decrease display refresh interval by 5 second \e[1m ? \e[0m or \e[1m h - \e[0m for this help \e[1m q \e[0m - quit press \e[1m ANYKEY \e[0m to continue.. \e[37m \x1b[30m version 0.1, copyright: valynkin pavel, 2015\e[0m HELP_SCREEN #<STDIN>; PortableReadKey::getKeyBlocking(); seek (LOGFILE,-1,2) # go forward to the end of file (to prevent harm stats if user see help screen too long) } sub keys_handler { my $key = shift; switch ($key) { case "q" {signal_handler;} case "+" {if ($output_freq >= 5) {$output_freq = $output_freq + 5;} else {$output_freq = $output_freq + 4;} } case "-" {if ($output_freq > 5) {$output_freq = $output_freq - 5;} else {$output_freq=1;} } case ["?","h"] {&helpscreen;} case ["M","m"] {$average_stats_window = ($average_stats_window eq "sec")?"min":"sec";} case ["C","c"] { $show_connects = !$show_connects; } case ["D","d"] { $show_domains = !$show_domains;} case ["R","r"] { $show_records = !$show_records;} case ["A","a"] {$show_connects = 1; $show_domains = 1; $show_records = 1; } case ["0","/"] {&set_view_to_default;} case "1" { $show_connects_details = !$show_connects_details; } case "2" { $show_domains_details = !$show_domains_details;} case "3" { $show_records_details = !$show_records_details;} case ["4","v"] { if ($show_all_details == 0) {$show_all_details=1; $show_connects_details=1; $show_domains_details=1; $show_records_details=1; } else {$show_all_details=0; $show_connects_details=0; $show_domains_details=0; $show_records_details=0; } } } } sub set_view_to_default { $show_connects = 1; $show_connects_details = 1; $show_domains = 1; $show_domains_details = 1; $show_records = 1; $show_records_details = 1; $show_all_details = 0; $average_stats_window = "min"; # must be "sec" or "min" } |